
Capacity Planning Reporting
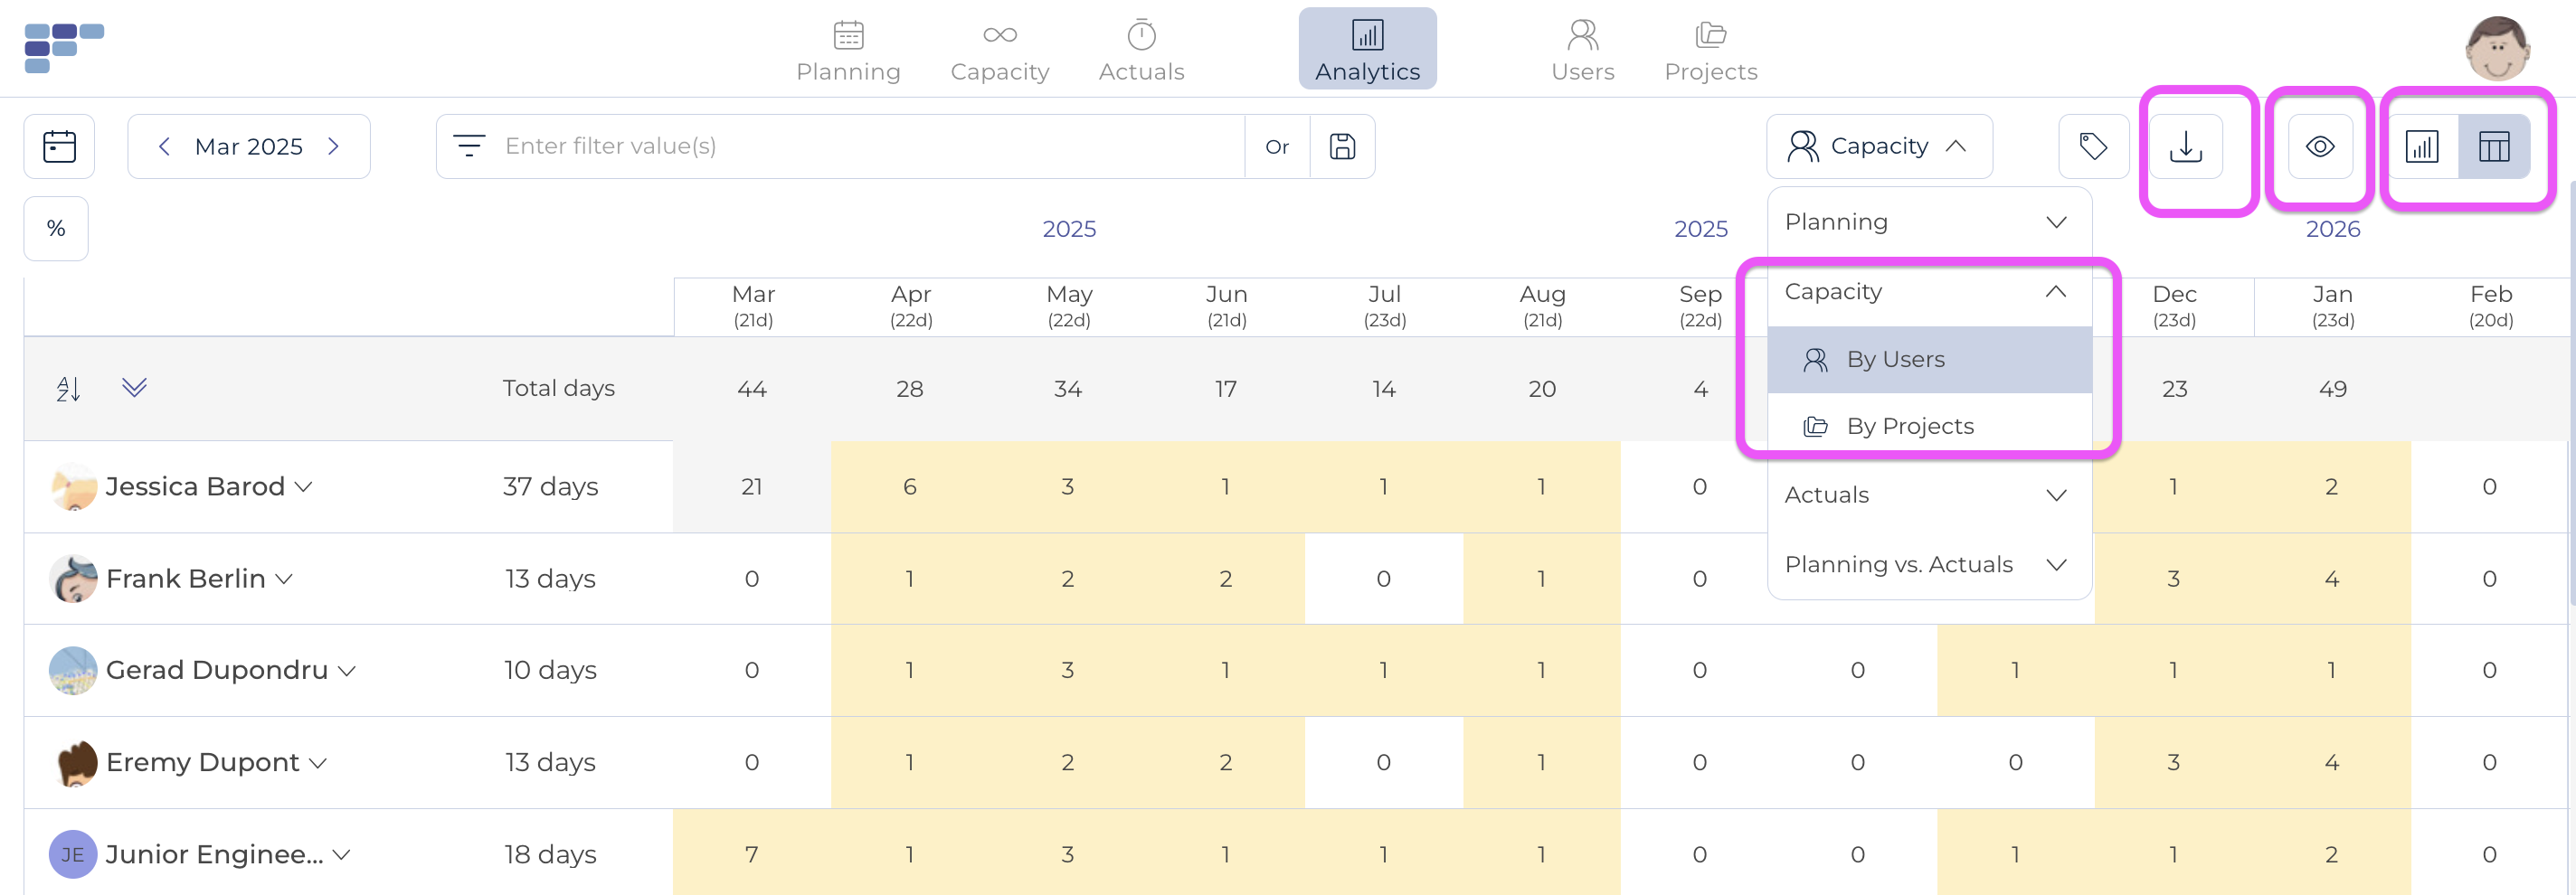
Capacity reporting can be found in the Analytics menu, that shows you the usual KPIs and key figures:

Clicking on reporting, you get a good overview of your capacity by users or by projects. The reporting by users may be split by Tags or Teams.
Notes:
- the visual settings ("eye icon") allows you to choose the time horizon, from 6 month to 2 years.
- the color codes indicate projects that are over/under-staffed (maybe the manager will have to do some re-allocations!) and users that planned over or under their capacity (-> maybe it is time to hire !).
- Last, report's data can be exported.