Analytics and Reporting
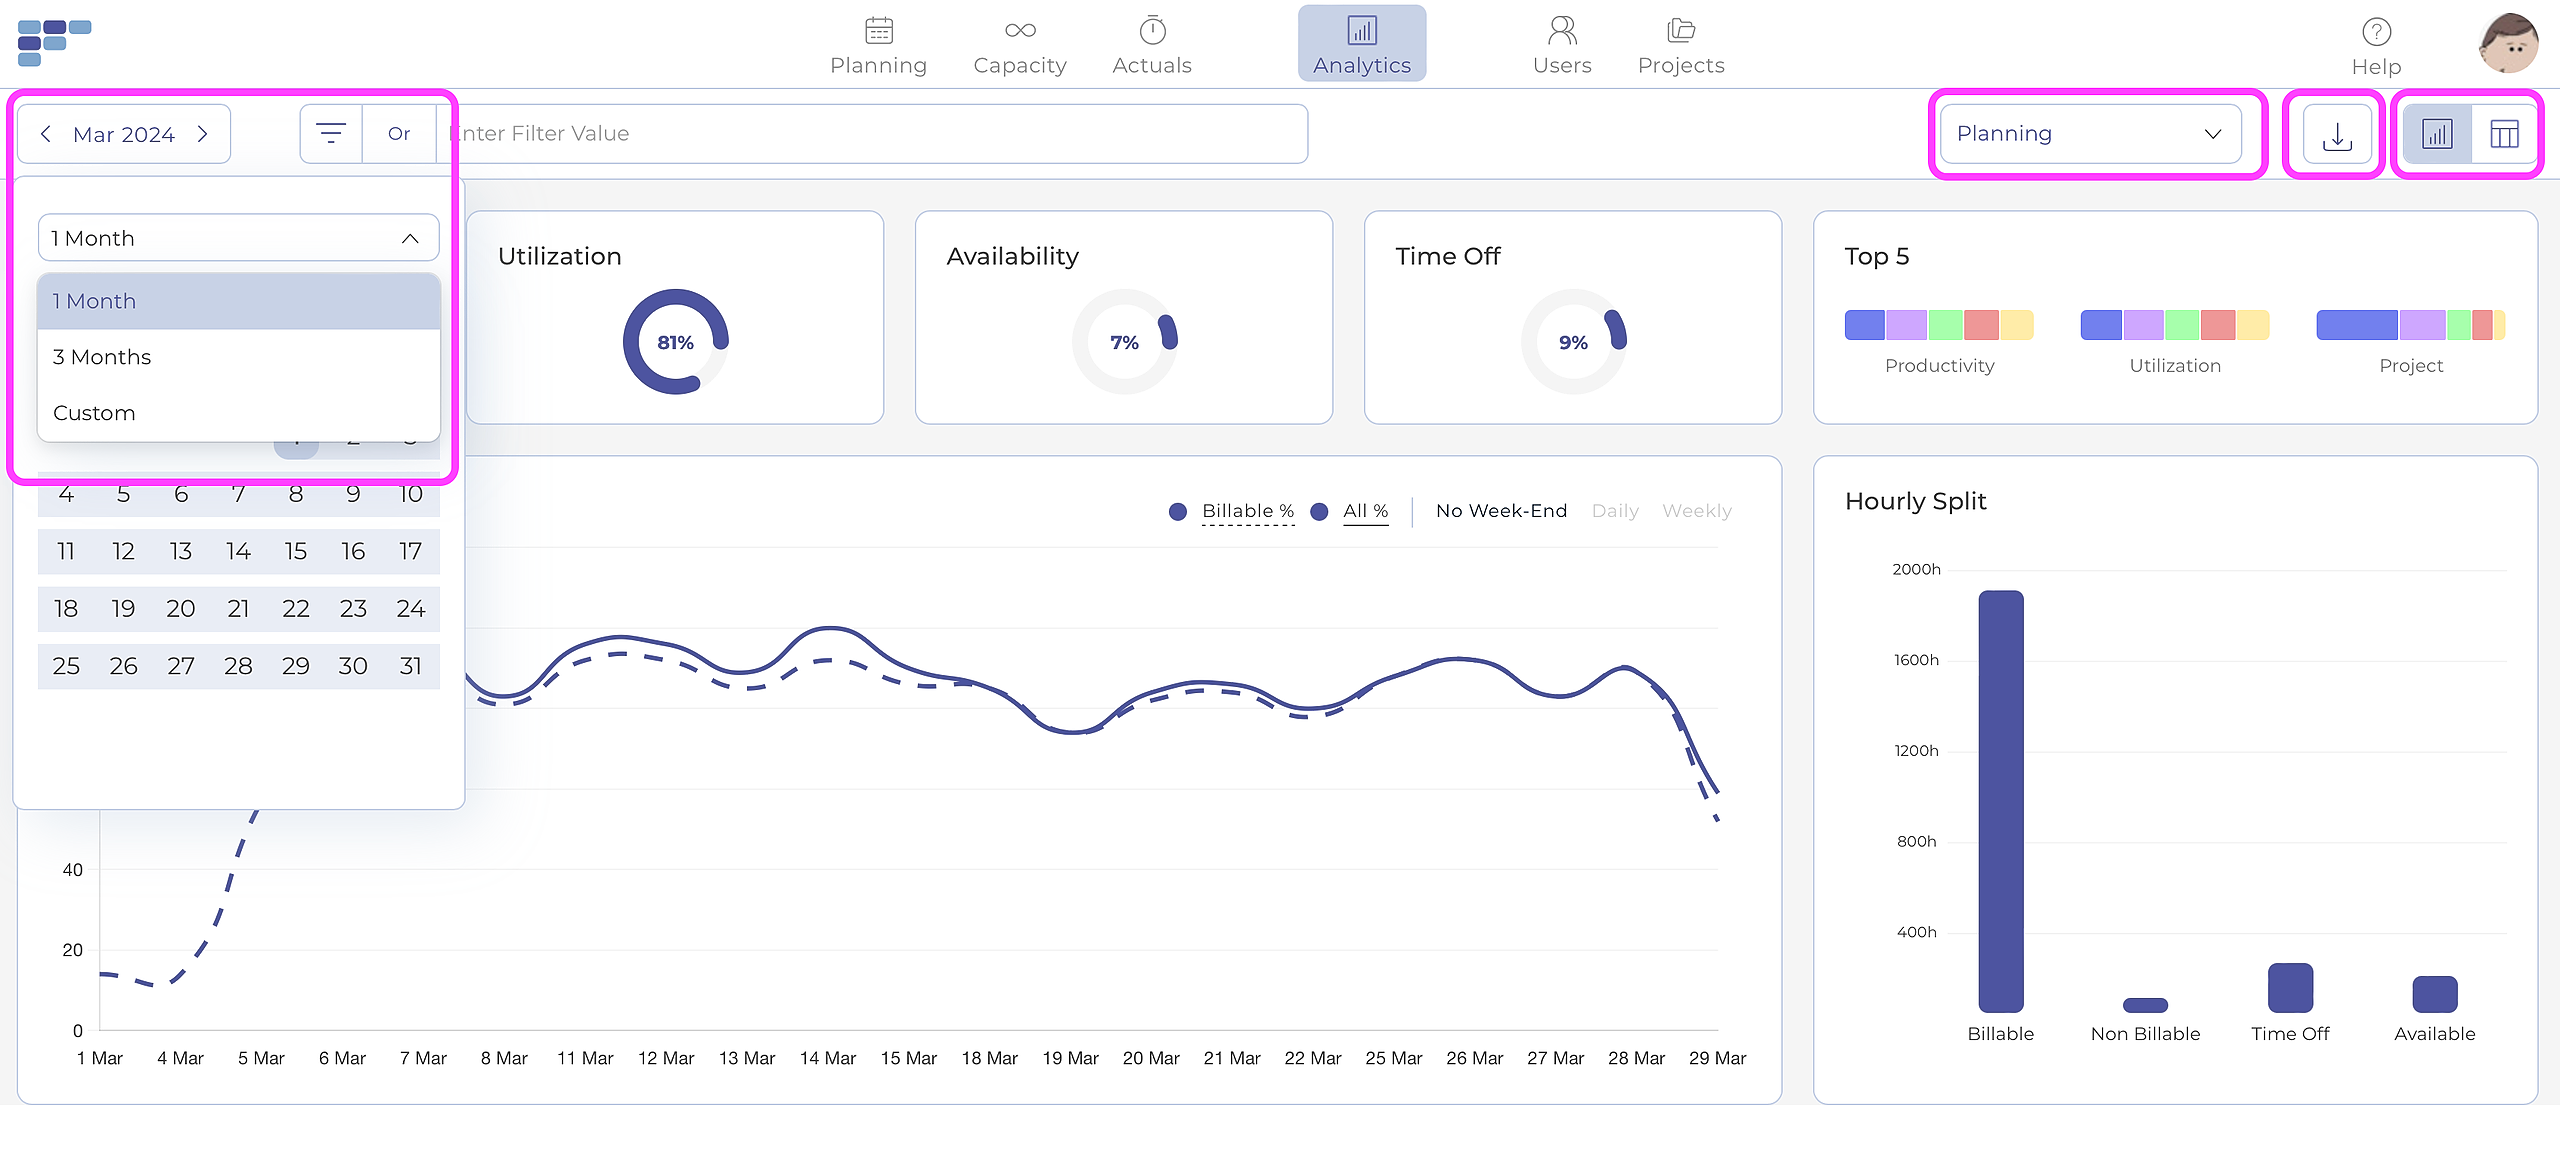
The Analytics section provides several tools to review and analyze data across Teambook:
- Predefined KPIs and dashboards – key performance indicators are displayed through graphs and dashboard elements. The dashboard includes:
- a utilization graph,
- key statistics, and
- “Top 5 / Low 5” indicators,
offering a quick view of team performance and trends.
- Summary table – an overview of the main figures in tabular format.
- Reporting access – a direct link to the reporting area for more detailed analysis.
Data from any Teambook module can be displayed in Analytics. Use the selector on the right to choose between:
- Planning data
- Actuals
- Capacity data
- Actual vs. Planning comparison
The displayed time period is set by default but can be adjusted using the date picker in the top-left corner. Available ranges depend on the data type:
- Planning & Actuals: 1 month, 1 quarter, or a custom range
- Capacity: 6 months, 1 year, or 2 years
Finally, two options are available in the top-right corner:
- Switch to reporting – opens predefined summary reports.
- Export – downloads records (bookings, capacity, actuals) in Excel format.
This video shows you the main features of the Analytics module:

